Arcast Financial Decision Support Software
Your projects involve many financial data streams. Arcast brings you one platform to manage them all.
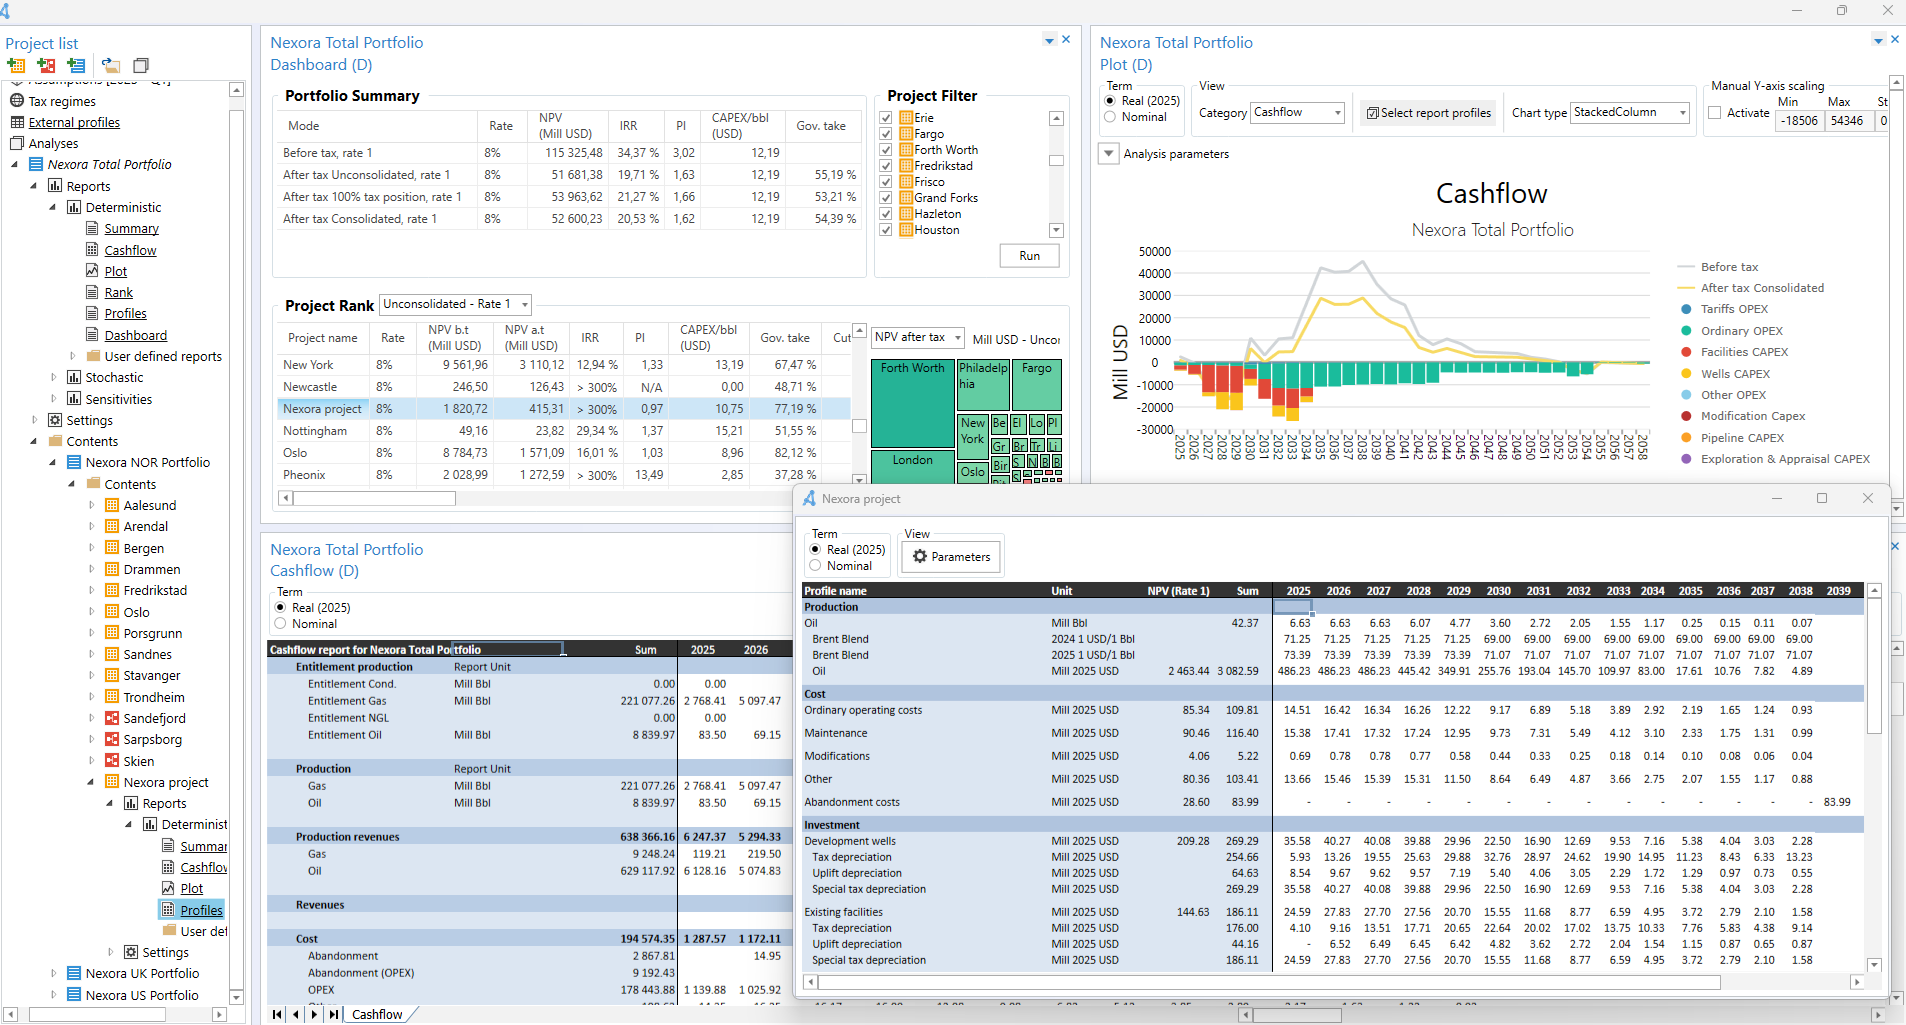
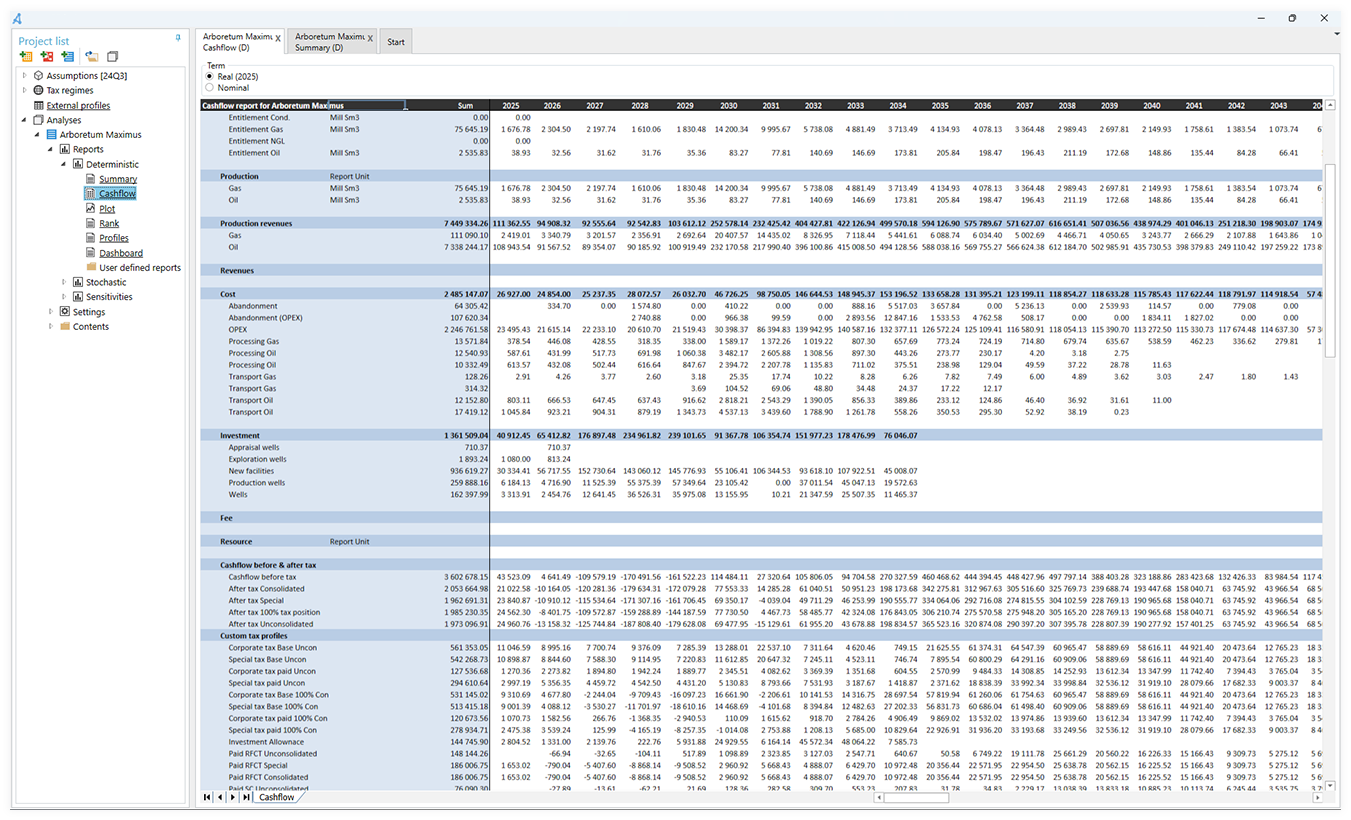
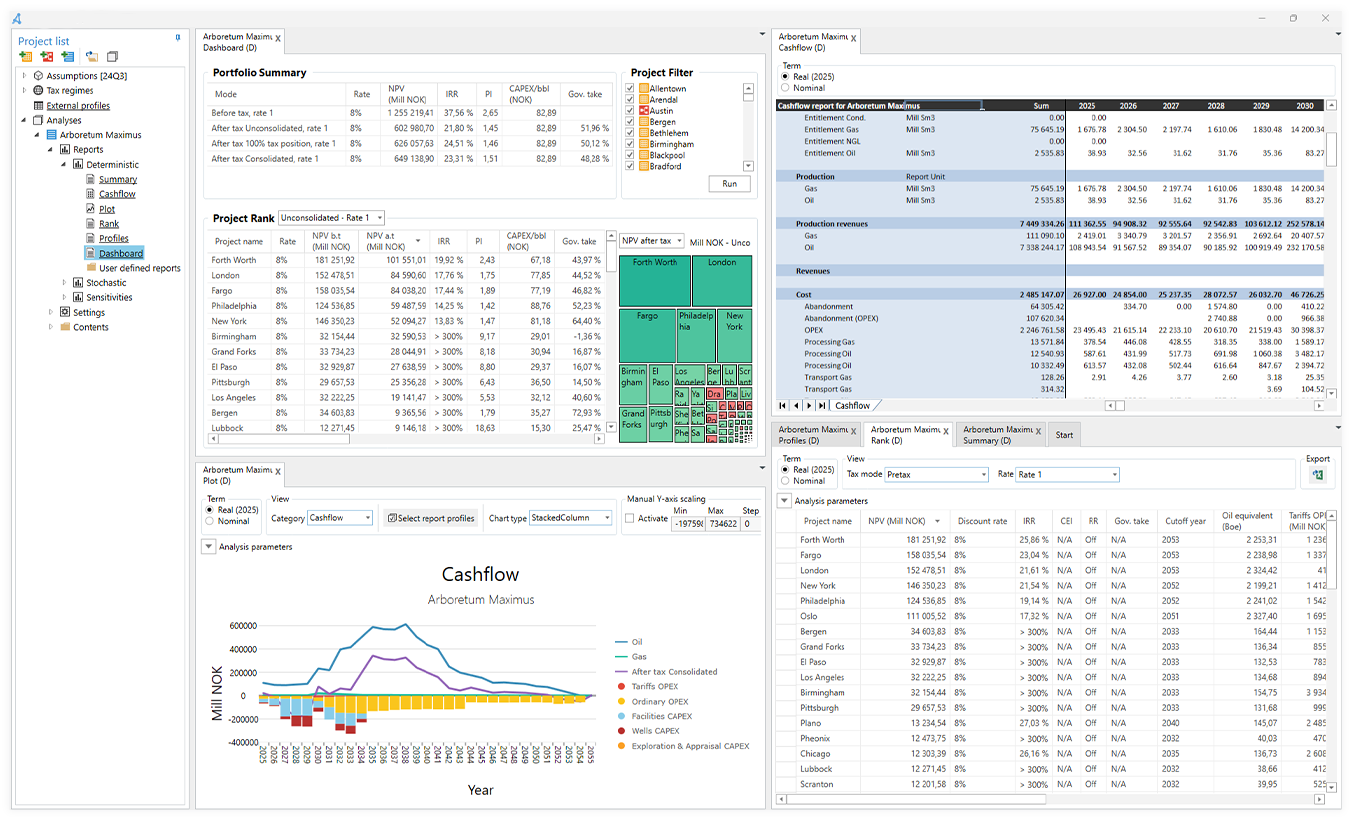
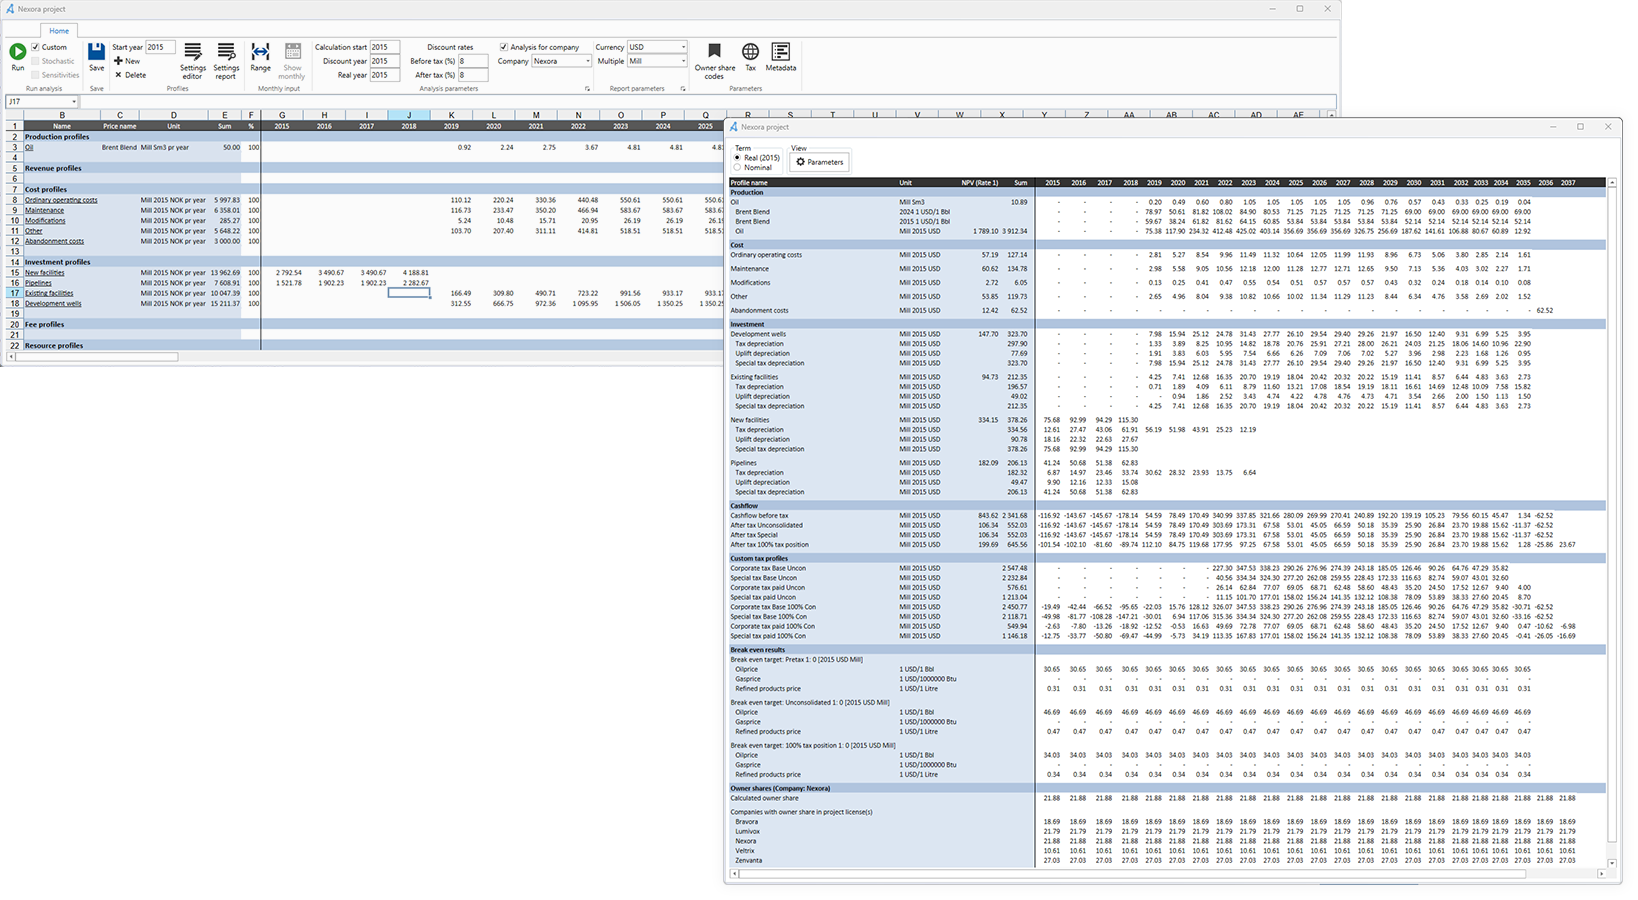
In Arcast, a project may represent a development project, an asset, or a case or instance you want to valuate. The valuation process of such a project involves both project-specific data as well as economic assumptions that may be valid across multiple projects or even an entire portfolio of projects. Project-specific data may consist of production profiles, investments, revenues, and operating costs. Economic assumptions may include the individual prices for the different products, as well as currencies and inflations. In some situations, you may also need to take into consideration the owner share of the project or asset.
Project valuation is a process that is often repeated over time, as the data and assumptions might change. There might also be several projects run in parallel, handled by different users. To be able to compare and rank projects there is a need for consistent calculations between users and over time are essential.