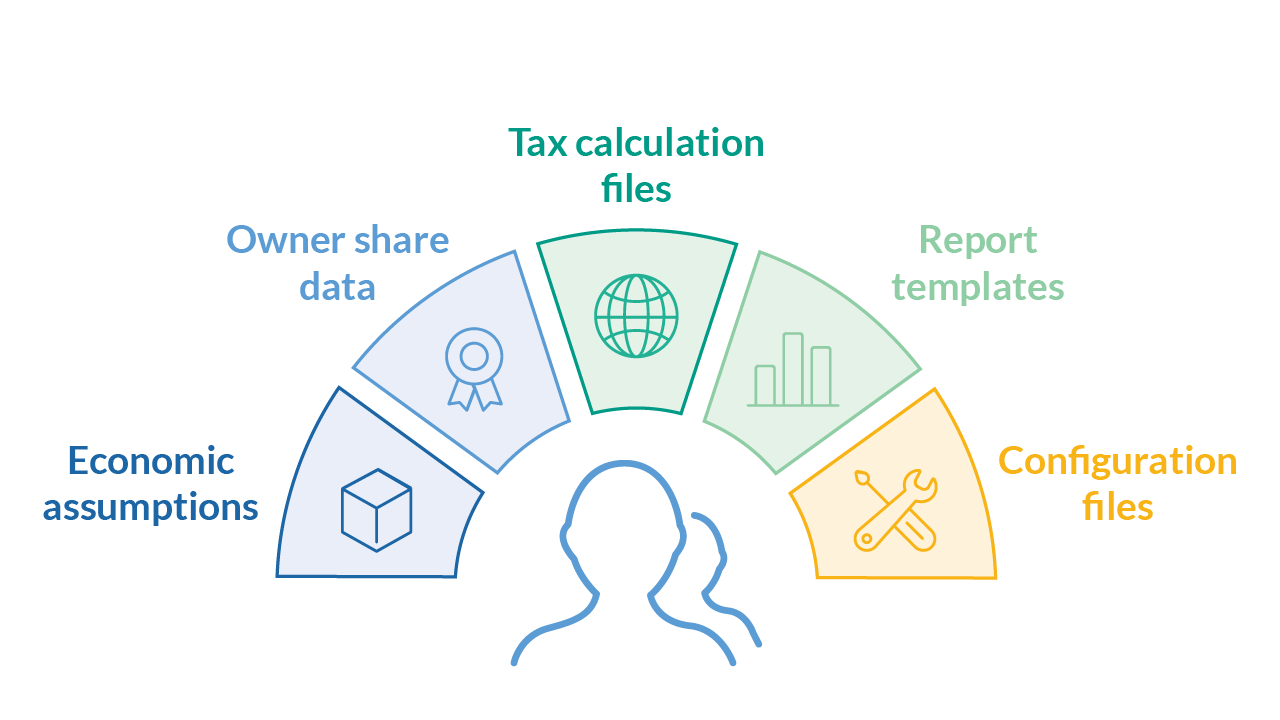
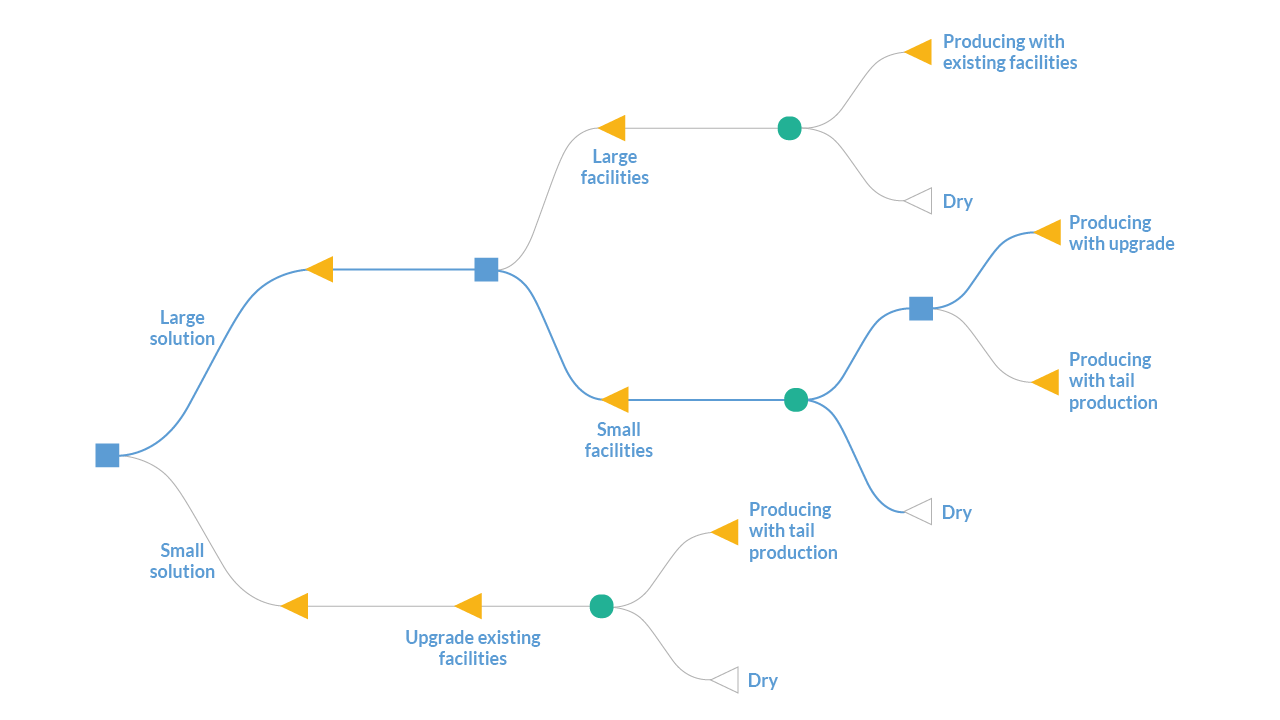
Arcast is built to ensure consistent calculations over time and between projects and users. This allows users to make head-to-head comparisons of different projects or different instances of the same project at different times. This is achieved through functionality to support versioning and sharing of:
When all calculations are performed with the same set of files, focus may be put on analyzing the results, rather than determining the differences between different calculations.


Arcast comes with a wide set of different calculation routines to help you study different aspects of your projects or portfolios, all built to let you focus on the results rather than debugging calculations.
All tax regimes in Arcast are modeled as separate Microsoft Excel® workbooks. These are loaded into Arcast, populated with data from the analysis, and executed. The populated tax file can be reviewed by the user, providing full transparency of the tax calculations. If a tax regime undergoes changes, only the corresponding tax file needs to be updated; then, the file may be automatically shared with all users. Consistent tax calculations also make it possible for tax consolidation of all projects belonging to the same tax regime.

Consistent calculations across projects make it possible to aggregate the results on a portfolio level, including full tax consolidation per tax regime, or several if applicable. Results are shown as total portfolio values but may also be broken down on each entity.
Decision tree modeling is often a good way to structure more complex decision scenarios in a visual and intuitive context. In Arcast, entire projects — including production, cost, and investment data — can be added to each end node in the tree. When calculating, full consolidation is performed along every branch of the tree.


After calculation, all results are presented in standardized reports, available in both nominal and real values, and visualized in tables, profile reports, or plots. These reports are structured in the same way for all analysis entities (i.e., projects, portfolios, and decision trees), making results recognizable and easily comparable between analysis types. Users can set up their own report templates to use in custom analysis or as part of their organization's reporting structure.
Microsoft and Excel are trademarks of the Microsoft group of companies.